


 LinkBack URL
 About LinkBacks


Hi
I've been challenged to display chart (live if possible) on userform.
I think solution can be handy for somebody so here is simple tutorial (of course type of chart or anything can be changed according to requirements):
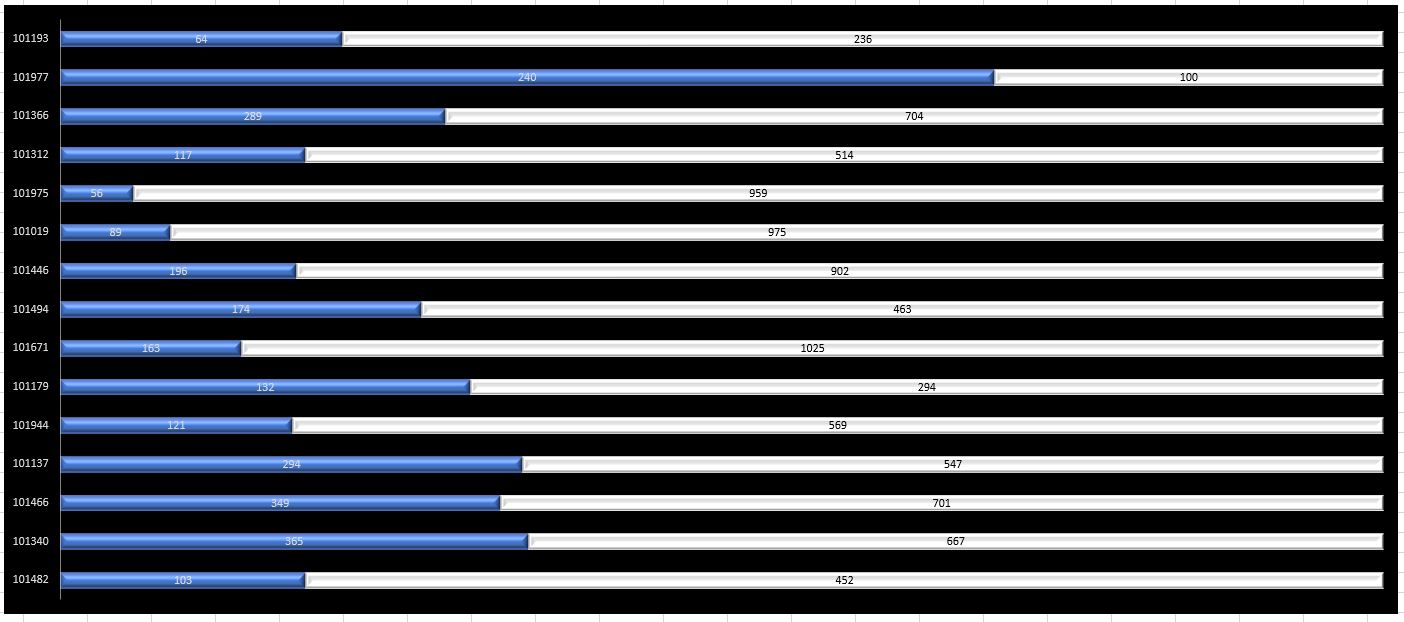
1. Based on data like this:
on separate sheet we can create chart for it:
size does not matter because later on we rescale ii to fit into userform and we can hide this tab (in excel or by VBA).
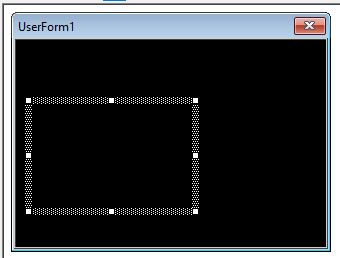
2. In VBE we create userform with image control on it, like below:
again size of form and control does not matter, we'll resize it later.
3. On UserForm code we can place:

Please Login or Register to view this content.
4. Now we have to use macro which save our chart into disk and display inside our form:
5. SaveChart macro can be assign into button, Voila!Please Login or Register to view this content.
In attached file you can find additionally macro which simulate data changes and display live changes on chart.
 Register To Reply
Bookmarks