


 LinkBack URL
 About LinkBacks

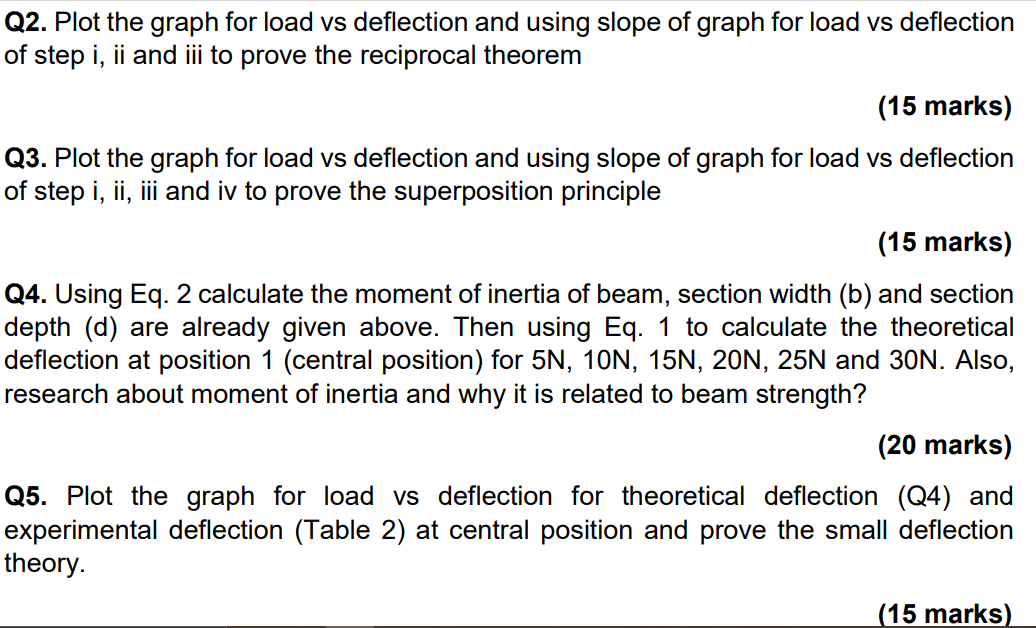
I am a huge Excel noob and am really struggling here, I have an assignment for university and struggling with plotting the chart.
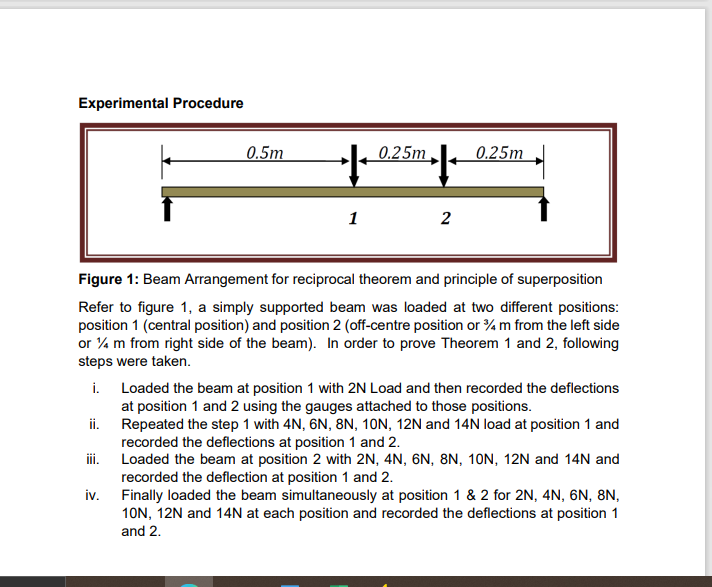
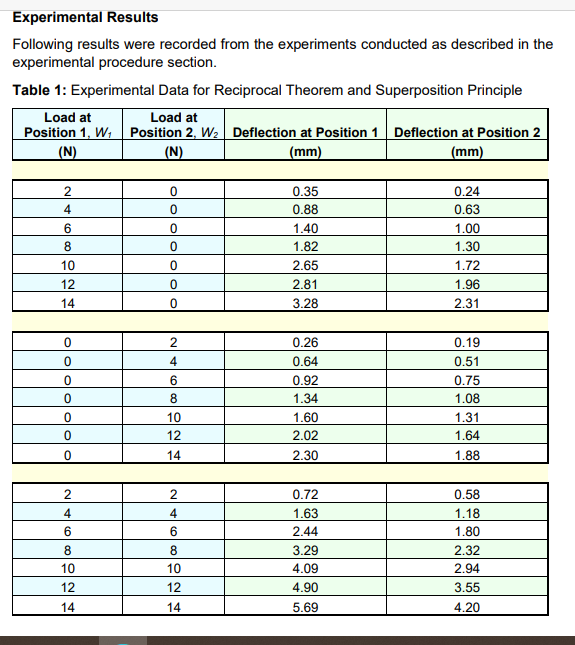
I need to plot these experimental results into a graph but can't seem to get it to work. I need to be able to compare the deflection for each stage of loading at point 1 and point 2, as per the questions attached. See attached images
Any help gratefully received
Chris
 Register To Reply
Bookmarks